The 64 Patterns of Forex
(No Philosophy Degree Required)
Every single day, the Forex market writes a secret message in its 4-hour charts. A message that’s 3,000 years old—encoded in the I Ching’s 64 hexagrams. Even more astonishing: there are only 64 possible patterns in a trading day’s 4-hour chart. Not 63. Not 65. Sixty-four. The same number as the I Ching’s ancient ‘map of reality.’ Here at The Tao of Forex, we unlock this system—and show how it can transform your trading psychology.
This isn’t astrology. This is about pattern recognition, binary mathematics, and the timeless rhythms of market psychology.
This system works because it guides you to see the market as a living thing—breathing in cycles, not chaos.
The 64-Pattern Mirror
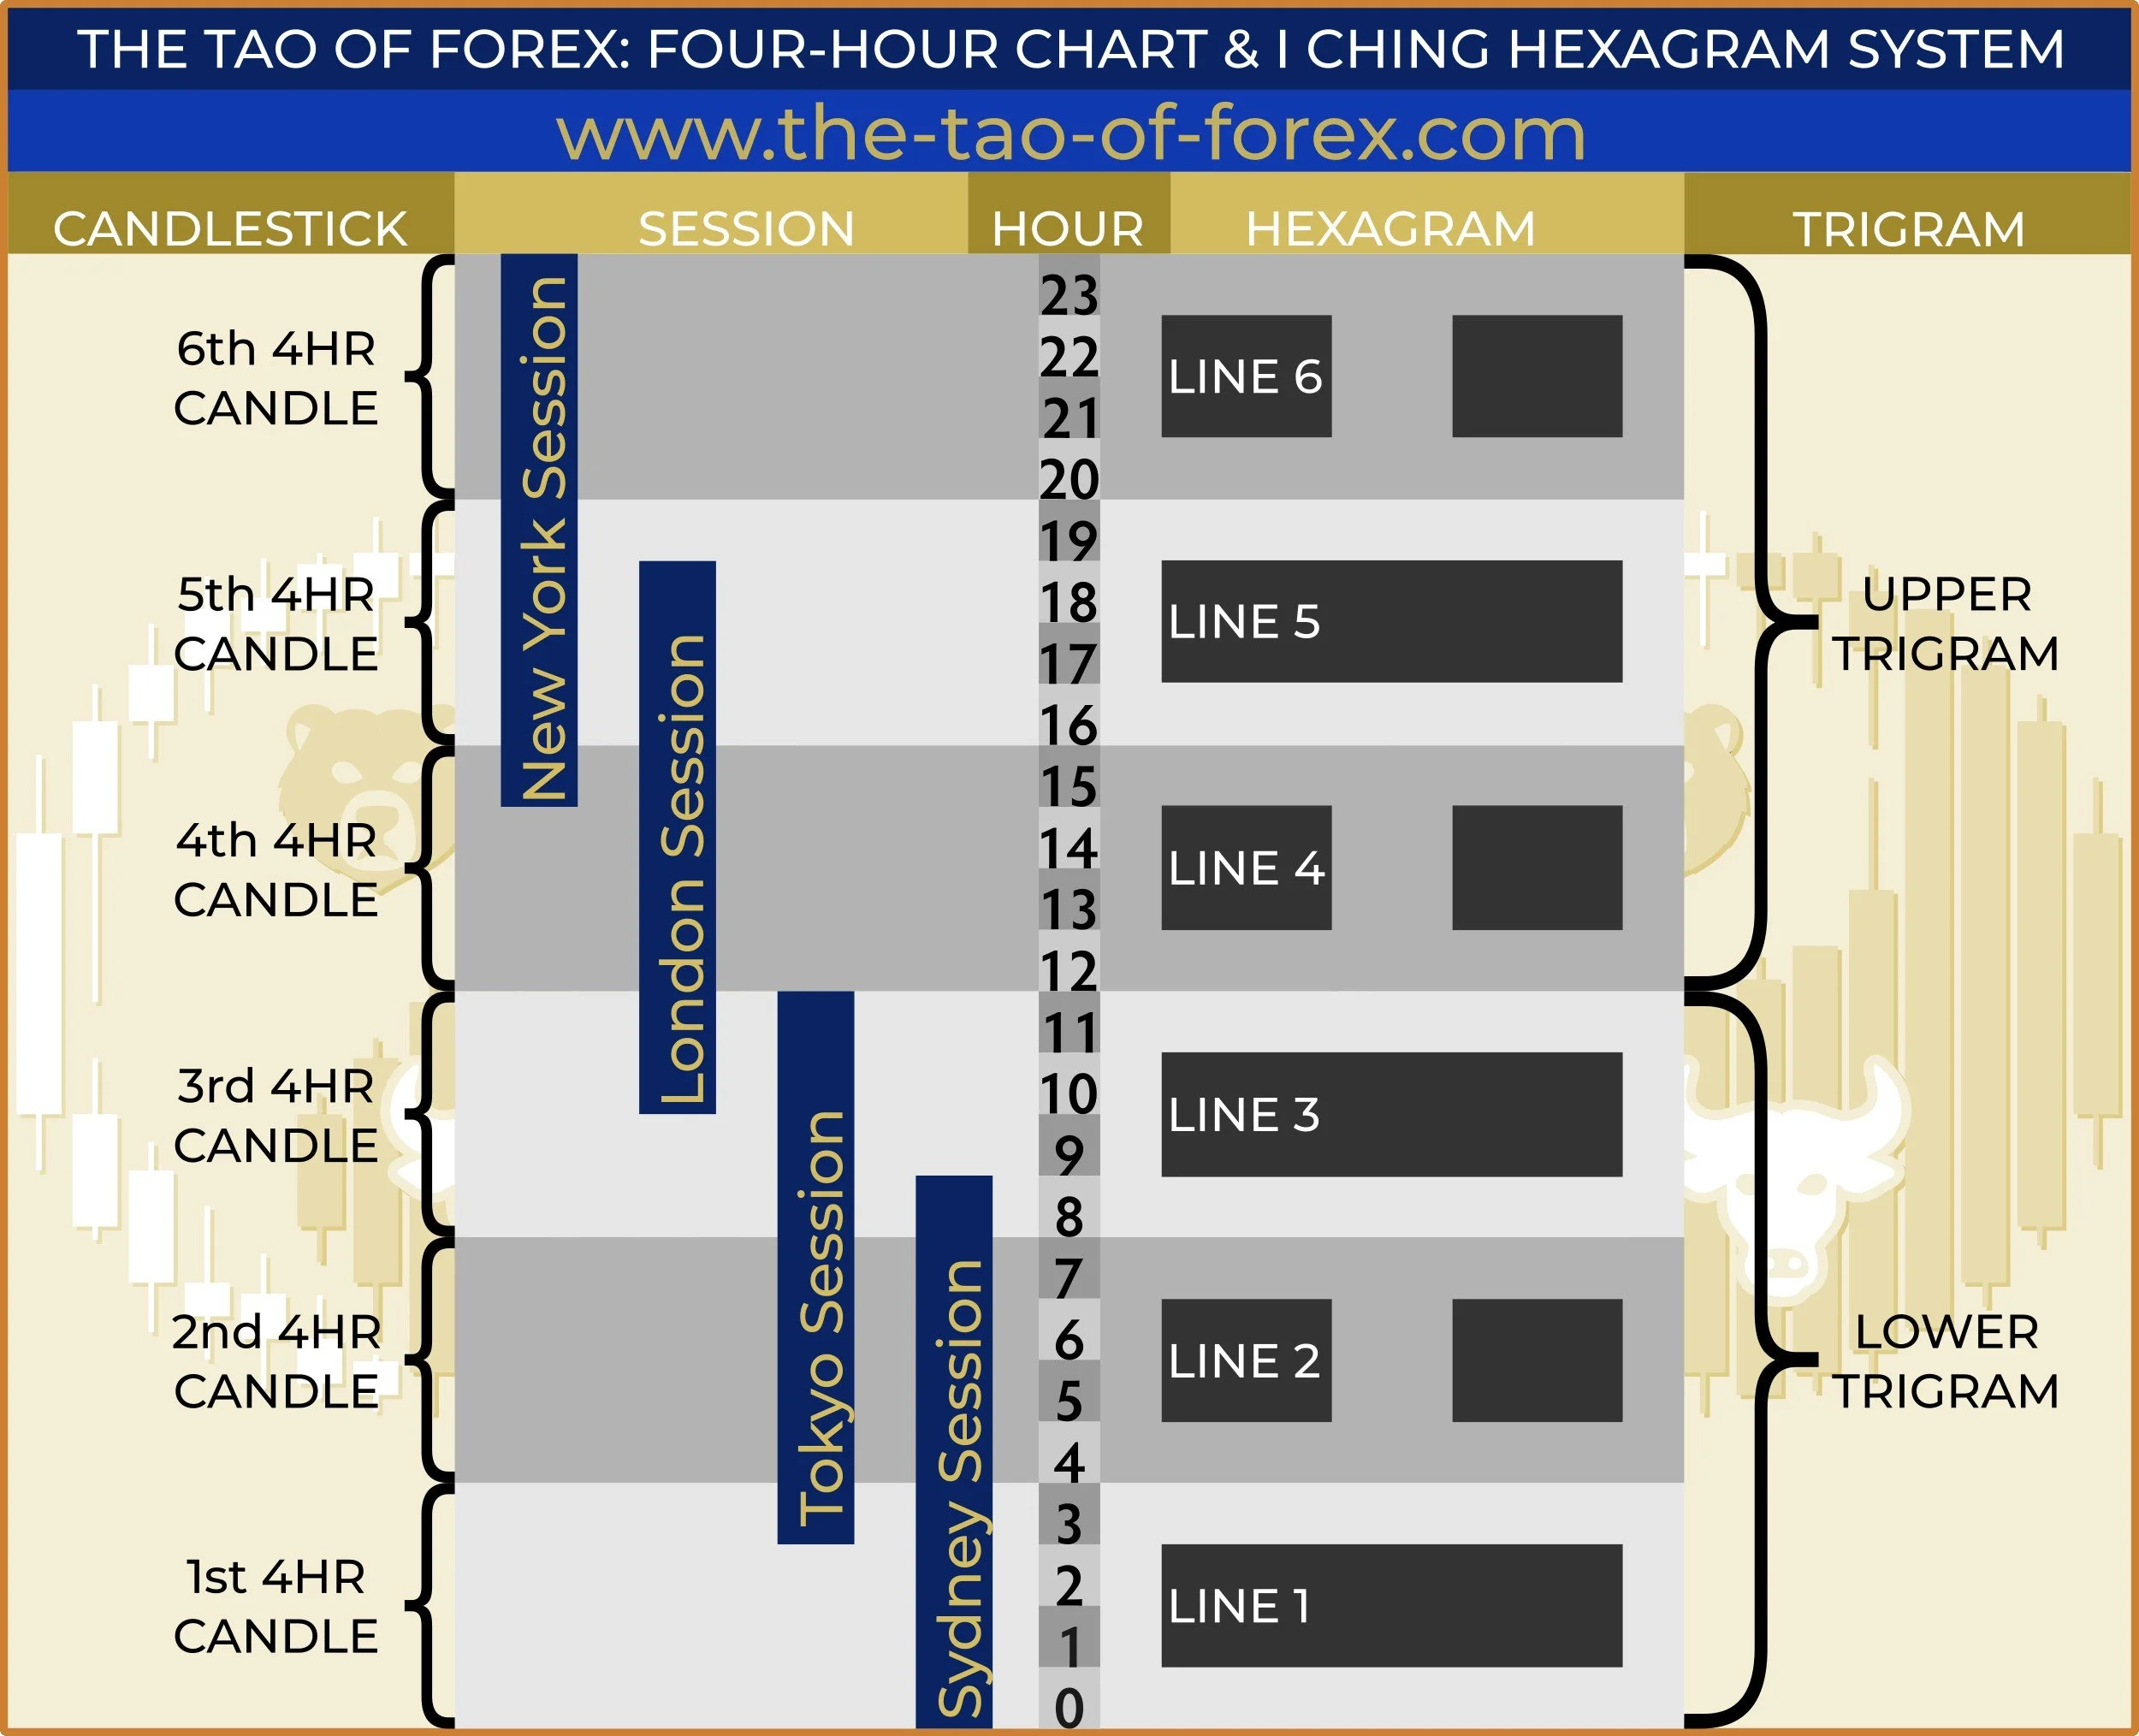
Why 64? It’s the Binary Code of Markets. A 4-hour chart shows six candles per day. Each candle is binary: it’s either bullish (Yang) or bearish (Yin). Just like the I Ching’s lines. Six binary choices mean 2^6 possible combinations … which equals 64.
But here’s the magic: the I Ching’s 64 hexagrams aren’t random. They represent every possible state of change—growth, collapse, tension, harmony. And markets? They’re just a mirror of human psychology, cycling through those same states.
Engage with the chart as a living, evolving Taoist text, where every new candle deepens (or transforms) your insight.
Each line of the hexagram can represent a 4-hour period, and the yin/yang nature of the lines (broken or unbroken) can be used to reflect the market's behavior during that time. Here's how each line might symbolize and correspond to a 4-hour period on the chart:
1. First Line (Bottom Line) – The Foundation (First 4-Hour Period)
Symbolism: Represents the initial phase of the market cycle, where trends or patterns are just beginning to form.
Market Interpretation: This period may indicate the emergence of a new trend, a reversal, or the continuation of an existing trend. It sets the tone for the next 20 hours (5 periods). A yang (unbroken) line suggests strong momentum or bullish activity, while a yin (broken) line indicates weakness or bearish sentiment.
Action: Traders might look for confirmation of a trend or prepare for potential opportunities based on this initial movement.
2. Second Line – Inner Development (Second 4-Hour Period)
Symbolism: Represents the internal dynamics of the market, such as consolidation, indecision, or the buildup of energy.
Market Interpretation: This period often reflects market sentiment and the underlying forces at play. A yang line suggests growing strength or confidence, while a yin line indicates hesitation or a lack of direction.
Action: Traders might watch for patterns like triangles, flags, or other consolidation formations that could lead to a breakout or reversal.
3. Third Line – Transition (Third 4-Hour Period)
Symbolism: Marks a critical juncture between the lower and upper trigrams, representing a potential shift in market direction or momentum.
Market Interpretation: This period often signals a decisive move, such as a breakout, reversal, or continuation of the trend. A yang line suggests a strong push in the current direction, while a yin line indicates a possible pullback or reversal.
Action: Traders might look for confirmation of a trend continuation or reversal, adjusting their positions accordingly.
4. Fourth Line – External Influence (Fourth 4-Hour Period)
Symbolism: Represents the market's interaction with external factors, such as news events, economic data, or broader market trends.
Market Interpretation: This period often reflects the impact of external forces on price action. A yang line suggests that external factors are supporting the trend, while a yin line indicates resistance or a shift in sentiment.
Action: Traders should be aware of news events or macroeconomic factors that could influence the market during this period.
5. Fifth Line – Peak (Fifth 4-Hour Period)
Symbolism: Represents the height of the market cycle, where the trend reaches its maximum strength or momentum.
Market Interpretation: This period often corresponds to the climax of a trend, where prices may overextend before a potential reversal. A yang line suggests strong bullish momentum, while a yin line indicates a possible top or weakening trend.
Action: Traders might consider taking profits or preparing for a potential reversal, especially if overbought or oversold conditions are present.
6. Sixth Line (Top Line) – Culmination (Sixth 4-Hour Period)
Symbolism: Represents the end of the cycle, where the market reflects on the past movements and prepares for a new phase.
Market Interpretation: This period often indicates exhaustion of the trend, a reversal, or the beginning of a new cycle. A yang line suggests a final push in the current direction, while a yin line indicates a reversal or consolidation.
Action: Traders might look for signs of trend exhaustion, such as divergence or reversal patterns, and prepare for the next cycle.
Now Let’s take it Step-by-Step
If you are unfamiliar with Taoism or the I Ching, here’s a streamlined, intuitive guide for easy reference:
The Binary Basics
Each candle = 1 line of a hexagram.
✅ Bullish candle (close > open) = Yang (⚊)
❌ Bearish candle (close < open) = Yin (⚋)
➰ Doji (open ≈ close) = "Changing line" (watch for reversals)
Why 64 patterns?
6 candles/day × 2 outcomes (Yin/Yang) = 2⁶ = 64 combos.
6 lines = 6 candlesticks (24 hours ÷ 4-hour periods).
Lines are built bottom-up (oldest to newest price action).
Rule: Focus on the candle’s body (open/close), not wicks.
Build Your Hexagram in 3 Steps
Example: a GBP/JPY 4-hour Chart
Time Candle Hexagram Line
00:00–04:00 Bullish ⚊ (Yang)
04:00–08:00 Bearish ⚋ (Yin)
08:00–12:00 Bullish ⚊ (Yang)
12:00–16:00 Bearish ⚋ (Yin)
16:00–20:00 Bullish ⚊ (Yang)
20:00–00:00 Bearish ⚋ (Yin)
Stack the lines bottom-to-top:
⚋ (Line 6)
⚊ (Line 5)
⚋ (Line 4)
⚊ (Line 3)
⚋ (Line 2)
⚊ (Line 1)
This candlestick pattern converts into Hexagram 63: ䷾ “After Completion,” which carries a message such as, “After success, reassess—complacency breeds failure.” (In-depth interpretations of all of the 64 hexagrams can be found here.)
Trigrams: The Market’s "Morning vs. Afternoon Mood"
A hexagram splits into two trigrams (upper/lower, each 3 lines).
Lower Trigram (Lines 1-3): First 12 hours (00:00–12:00).
Upper Trigram (Lines 4-6): Second 12 hours (12:00–00:00).
Split your hexagram into two 3-line chunks:
Lower Trigram (Lines 1-3): 00:00–12:00
Example: Bullish/Yang, Bearish/Yin, Bullish/Yang = ☲ Fire (volatility).Upper Trigram (Lines 4-6): 12:00–00:00
Example: Bearish/Yin, Bullish/Yang, Bearish/Yin = ☵ Water (pullback).
Fire ☲ + Water ☵ = Conflict → Choppy price action.
(In-depth interpretations of all 8 trigrams can be found here.)
Changing Lines and Transformations
If any of the lines are "changing," represented by a Doji candlestick (open ≈ close; i.e., transforming from yin to yang or vice versa), this could indicate a significant shift in market sentiment or direction during that 4-hour period. The resulting hexagram would provide additional insight into the evolving market dynamics.
Practical Application
1. Trend Identification: Use the hexagram to identify the overall trend and potential turning points over a 24-hour period.
2. Pattern Recognition: Correlate the yin/yang lines with candlestick patterns, support/resistance levels, or technical indicators.
3. Decision-Making: Use the symbolism of each line to guide trading decisions, such as entering or exiting positions, setting stop-loss levels, or taking profits.
This dynamic, meditative approach aligns with the Taoist principle of flow—where each candle is not just a static data point, but a living expression of market energy interacting with the candles around it. It combines the philosophical depth of the I Ching with the analytical rigor of technical analysis, offering a unique perspective on market behavior. However, it’s important to remember that this method is highly interpretive and should be used in conjunction with other technical and fundamental analysis tools.
You don't have to wait and view charts as completed hexagrams, but instead they can dynamically view each candlestick through the lens of Taoism and ponder each candlestick's relationship with its adjacent candlesticks. And that their insights and meditations can evolve as each subsequent candlestick forms.
Reading the Breath of the Market
Markets are like rivers—constantly moving, never the same.
Each candle is a "word" in the market’s story, and its meaning shifts based on what came before and what comes after. No need to wait for a full hexagram—even a single candle can reveal imbalance (e.g., an excessively long yang candle hints at exhaustion).
Let go of rigid patterns (e.g., waiting for a full hexagram).
Focus on the "now" energy (last 1–3 candles).
Adapt like water—flow with the market’s changing story.
When you’re engaging in your technical analysis, consider asking: "What is this candle reacting to? What energy (Yin/Yang) is dominant, and how is it being answered?"
Converting 4-hour charts into I Ching hexagrams can also bring insights for trading tactics. For example:
Hexagram Meaning Action
1 ䷀ “The Creative” Strong uptrend Ride momentum, but watch for exhaustion.
23 ䷖ “Splitting Apart” Market collapse Tighten stops; avoid new longs.
52 ䷳ “Mountain” Stagnation Stay patient—wait for breakout.
Real-Time Taoist Trading Psychology
Keep these in mind while you engage in your technical analysis:
"Wu Wei" (Effortless Action): Don’t force trades. Let setups come to you.
Yin-Yang Balance: Accept both wins and losses as natural.
Trigram Snapshots: Glance at the last 3 candles to sense shifts (e.g., Yang→ Yin→ Yang = "Fire" = potential breakout).
Detachment: Avoid emotional attachment to individual trades.
Practical Application
Journal Exercise: Build a hexagram each day and journal your insights.
1. Pick a currency pair.
2. Convert each 4-hour candle to Yin/Yang.
3. Build your hexagram.
4. Note: Did the market behave as the hexagram suggested?
Track daily hexagrams of the instruments that you are trading, and note how they align with market sentiment. Record the hexagram and note if the market’s "personality" matched the hexagram’s reading (e.g., "Hexagram 30 ䷝ “The Clinging” (Fire over Fire) = high volatility → Did it spike?" "Did Hexagram 23 ䷖ “Splitting Apart” (Mountain over Earth) precede a downturn?")
Why This Matters for Traders
Pattern Recognition: Repeating trigrams may signal recurring market phases (e.g., Hexagram 30 ䷝ “The Clinging" often precedes breakouts).
Mindset Tool: Hexagrams frame price action as a natural cycle, reducing emotional trading.
Imagine each 4-hour candle as a building block of a hexagram. Six candles complete the picture, but the first three lines—the lower trigram—tell you about the market’s ‘morning mood,’ while the upper trigram reveals its ‘afternoon energy.’ If the trigrams clash (like Fire vs. Water), it’s a sign to stay patient.
The Trader’s Koan: "The Chart Is Never Finished"
The Tao of Forex has the potential to offer traders like you not just a new analytical tool, but a profound way to reframe their entire relationship with the markets. Ancient systems often reveal timeless truths about human behavior, and trading is no exception.
This isn’t just another indicator. It’s a philosophy of trading—one that connects the dots between ancient wisdom, binary math, and trader psychology. That’s trading alchemy.
The Way of the Dynamic Trader
Trade the candle, not the dogma.
Let the hexagram grow organically—like a plant, not a puzzle.
The best signals are the ones that breathe.
The market is a river. The I Ching is your compass. You are the boatman.